This site uses cookies to improve your experience. To help us insure we adhere to various privacy regulations, please select your country/region of residence. If you do not select a country, we will assume you are from the United States. Select your Cookie Settings or view our Privacy Policy and Terms of Use.
Cookie Settings
Cookies and similar technologies are used on this website for proper function of the website, for tracking performance analytics and for marketing purposes. We and some of our third-party providers may use cookie data for various purposes. Please review the cookie settings below and choose your preference.
Used for the proper function of the website
Used for monitoring website traffic and interactions
Cookie Settings
Cookies and similar technologies are used on this website for proper function of the website, for tracking performance analytics and for marketing purposes. We and some of our third-party providers may use cookie data for various purposes. Please review the cookie settings below and choose your preference.
Strictly Necessary: Used for the proper function of the website
Performance/Analytics: Used for monitoring website traffic and interactions
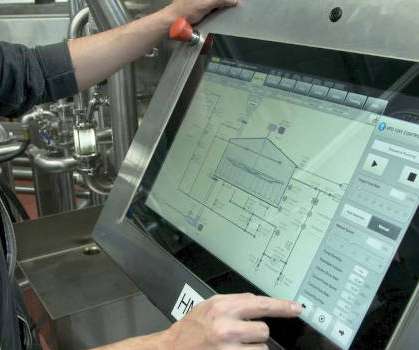
A variety of industries — automotive, healthcare, food and beverages, and beyond — are leveraging innovative eco-friendly manufacturing solutions by harnessing sustainable materials. Addressing challenges like human error, material loss, and geopolitical risks, these technologies improve traceability and supply-line resilience.
Markforged’s journey has been marked by groundbreaking innovations that have strengthened manufacturing resiliency, enabled industrial production at the point of need, and empowered manufacturers worldwide to create strong, accurate parts in both metal and advanced composites.
The share of manufacturing sector GDP registering a composite PMI ® calculation at or below 45 percent (a good barometer of overall manufacturing weakness) was 46 percent in October, a 5-percentage point increase compared to the 41 percent reported in September.
The share of manufacturing sector GDP registering a composite PMI calculation at or below 45 percent (a good barometer of overall manufacturing weakness) was 49 percent in December, a 1-percentage point increase compared to the 48 percent reported in November. .” This is concerning as it’s our peak season.”
Customers are looking to bend towards new ways of working that can overcome supplychain uncertainties and flex their operations to meet capacity and quality requirements, project by project,” noted Matt Williams, vice president of advanced fabrication markets-business development for Airgas.
Suppliers continue to have capacity but work to improve lead times, due to their raw material supplychain disruptions. Operational output is still strong, and the supplychain has the capacity to support. It took some customers longer to replenish their supplychain network after the fourth-quarter rush we commonly have.
Supplychain, staffing and COVID-19 are main concerns among SI Giant system integrators. Asphaltene turned into graphene for composites. Digital transformation at Gibson, control system integration for chemical, food and beverage. SI Giants 2023 average system integration revenue increases.
“Of the six biggest manufacturing industries, four — Food, Beverage & Tobacco Products; Fabricated Metal Products; Chemical Products; and Transportation Equipment, which account for a combined 54 percent of manufacturing gross domestic product (GDP) — registered growth in March. ’ Expectations are for a strong second quarter.
With Business Survey Committee panelists reporting softening new order rates over the previous 10 months, the March composite index reading reflects companies continuing to slow outputs to better match demand for the first half of 2023 and prepare for growth in the late summer/early fall period. .” Fiore continues, “The U.S.
The April composite index reading reflects companies continuing to manage outputs to better match demand for the first half of 2023 and prepare for growth in the late summer/early fall period. . Supplychains are prepared and eager for growth, as panelists’ comments support reduced lead times for their more important purchases.
The May composite index reading reflects companies continuing to manage outputs to better match demand for the first half of 2023 and prepare for growth in the late summer/early fall period. . Labor shortages are getting better within our organization and throughout our supplychain.”
The August composite index reading reflects companies managing outputs appropriately as order softness continues, but the month-over-month increase is a sign of improvement. This is likely due to customers’ increased confidence in the supplychain, (which) has them reducing their inventories. percent reported in July.”
More concerning: The share of sector GDP registering a composite PMI ® calculation at or below 45 percent (a good barometer of overall manufacturing weakness) was 53 percent in July, 39 percentage points higher than the 14 percent reported in June. Supplychain pipelines and inventories remain full, reducing the need for overtime.
The Customers’ Inventories Index reading indicated improved supplychain efficiency, as output improved and customers’ inventories continued to decline. “Of the six biggest manufacturing industries, two — Food, Beverage & Tobacco Products; and Petroleum & Coal Products — registered growth in September.
More importantly, the share of sector GDP registering a composite PMI ® calculation at or below 45 percent — a good barometer of overall manufacturing weakness — was 27 percent in January, compared to 48 percent in December, and 54 percent in November. ” [Food, Beverage & Tobacco Products] “U.S.
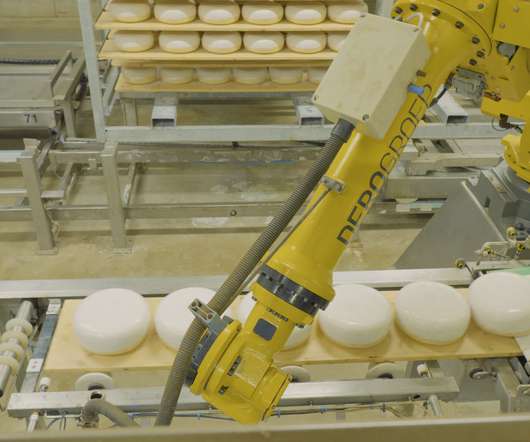
One of the biggest challenges for dairy manufacturers such as Amalthea is that milk composition varies across farms and seasons. In 2020, Amalthea modernized its ERP with Infor CloudSuite Food & Beverage and leveraged the power of Infor’s cloud technology platform, Infor OS, to solve a critical milk yield business problem.
With Business Survey Committee panelists reporting softening new order rates over the previous nine months, the February composite index reading reflects companies continuing to slow outputs to better match demand for the first half of 2023 and prepare for growth in the second half of the year. .” Fiore continues, “The U.S.
With Business Survey Committee panelists reporting softening new order rates over the previous nine months, the January composite index reading reflects companies slowing outputs to better match demand in the first half of 2023 and prepare for growth in the second half of the year. .” Fiore continues, “The U.S.
More concerning is the share of sector GDP registering a composite PMI ® calculation at or below 45 percent — a good barometer of overall manufacturing weakness — was 14 percent in June, 10 percentage points higher than the 4 percent reported in May,” says Fiore. WHAT RESPONDENTS ARE SAYING “High volume of customer orders.”
With Business Survey Committee panelists reporting softening new order rates over the previous seven months, the December composite index reading reflects companies’ slowing their output. Managing head counts and total supplychain inventories remain primary goals as the sector closes the year. WHAT RESPONDENTS ARE SAYING.
“Of the six biggest manufacturing industries, two — Food, Beverage & Tobacco Products; and Transportation Equipment — registered growth in November. The three manufacturing industries that reported growth in November are: Food, Beverage & Tobacco Products; Nonmetallic Mineral Products; and Transportation Equipment.
The July composite index reading reflects companies continuing to manage outputs down as order softness continues. ” [Food, Beverage & Tobacco Products] “Suppliers are starting to reach out looking for new business. The Imports Index remained in contraction territory, registering 49.6 percent, 0.3
Suppliers continue to have capacity but are showing signs of struggling, due in part to their raw material supplychains. ” [Food, Beverage & Tobacco Products] “Customer softness continues in China , Japan and Europe.” Additional distribution has allowed us to maintain consistent production shifts.”
More importantly, the share of sector GDP registering a composite PMI ® calculation at or below 45 percent — a good barometer of overall manufacturing weakness — was 4 percent in May, the same as in April, but an indication of better health than the 27 percent recorded in January.
Panelists are now expressing concern about a softening in the economy, as new order rates contracted for the second month amid developing anxiety about excess inventory in the supplychain. Overstock of raw materials due to prior supplychain issues and slowing orders.” WHAT RESPONDENTS ARE SAYING. Production.
The product has garnered widespread interest in the greater food and beverage industry as a replacement for traditional plastics such as straws, chip bags, single-use water bottles, etc. Full-scale challenges: Supplychain, automation scope, 4000 I/O. This project held many challenges.
The share of manufacturing sector GDP registering a composite PMI ® calculation at or below 45 percent (a good barometer of overall manufacturing weakness) was 48 percent in November, a 2-percentage point increase compared to the 46 percent reported in October.
We organize all of the trending information in your field so you don't have to. Join 45,000+ users and stay up to date on the latest articles your peers are reading.
You know about us, now we want to get to know you!
Let's personalize your content
Let's get even more personalized
We recognize your account from another site in our network, please click 'Send Email' below to continue with verifying your account and setting a password.


Let's personalize your content